データをクラスタリングするk-means法を書いてみた
データをいくつかのグループにクラスタリングする手法としてk-means法があります。MatlabのStatistics and Machine Learning Toolboxには、kmeansというそのものズバリの関数があるのですが、アルゴリズムを体感するために自分で書いてみました。
Wikipediaによると、大まかなアルゴリズムは下の通り。
- 各データ点x(i)に対してランダムにクラスタを割りあてる。(クラスタ数は最初に自分で決める必要がある)
- 割りあてたデータ点をもとに、各クラスタの中心V(j)を計算。
- 各x(i)と各V(j)との距離を求め、x(i)を最も近い中心のクラスタに割りあてなおす。
- 上記の処理で、すべてのx(i)のクラスタの割り当てが変化しなかった場合、収束したと判断して終了。そうでない場合は、新しく割り振られたクラスタからV(j)を再計算して上記の処理を繰り返す。
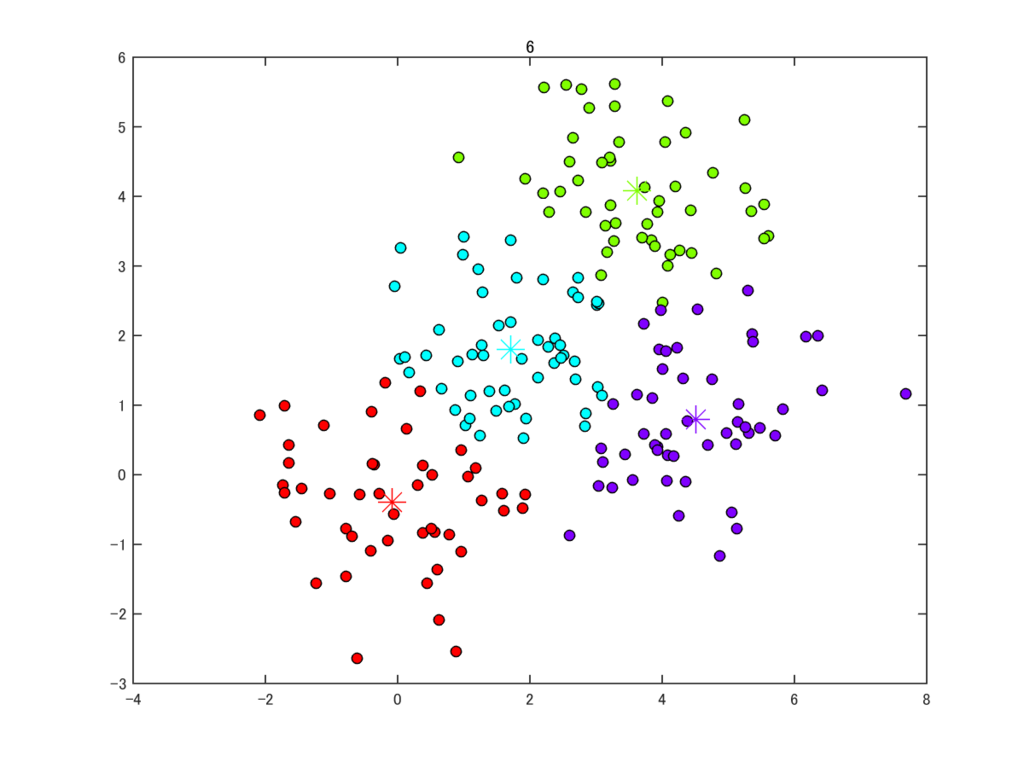
これをそのまま試してみました。データとしては、50点からなるクラスタを適当に4つ撒きました。


このデータだと7ステップで収束して処理が終了しました。それっぽくクラスタリングできていますね。
このオリジナルの方法はとても単純なのですが、このままだと、一番最初のランダムなクラスタの割りあてに依存して、明らかに変なクラスタリングをしてしまう場合もあります。この点を改良したk-means++法というのもあり、Matlabのkmeans関数で実装されているのはこちらのようです。
ほかに、複数のクラスタへの帰属を許した fuzzy c-means法というのもあったりします。
今回のコードは下の通り。
clear
rng(13)

% data
x = randn(50,2);
for ii=1:3
    x = [x; randn(50,2)+repmat(rand(1,2)*5,50,1)];
end

% number of clusters
k = 4;

% assign initial clusters randomly
clu = randi(k,[size(x,1),1]);

h = figure(1); clf
cycle=0;
while 1
    cycle = cycle+1;

    % centroids of clusters
    V = nan(k,2);
    for ii=1:k
        V(ii,:) = mean(x(clu==ii,:));
    end

    % plot
    for ii=1:k
        rgb = hsv2rgb(1/k*ii,1,1);
        % individual data points
        plot(x(clu==ii,1),x(clu==ii,2),'ko','markerfacecolor',rgb); hold on
        % centroid
        plot(V(ii,1),V(ii,2),'*','markersize',15,'color',rgb);
    end
    title(cycle)
    drawnow
    hold off
    % save image
    saveas(h,num2str(cycle),'png')

    % distance between data points and centroids
    d = nan(size(x,1),k);
    for ii=1:k
        d(:,ii) = sqrt( (x(:,1)-V(ii,1)).^2+(x(:,2)-V(ii,2)).^2 );
    end

    % update cluster label to the nearest centroid
    [~,cluNew] = min(d,[],2);

    % break if the new cluster label is identical to the previous one
    if any(clu~=cluNew)
        clu = cluNew;
    else
        break;
    end
end