データをクラスタリングするk-means法を書いてみた (Python 編)
以前に MATLAB で書いた教師無しクラスタリング法 k-means のコードを、Python で書き直してみました。ほぼ初の Python コードなので、怪しいかもしれませんが、ひとまず動きました。
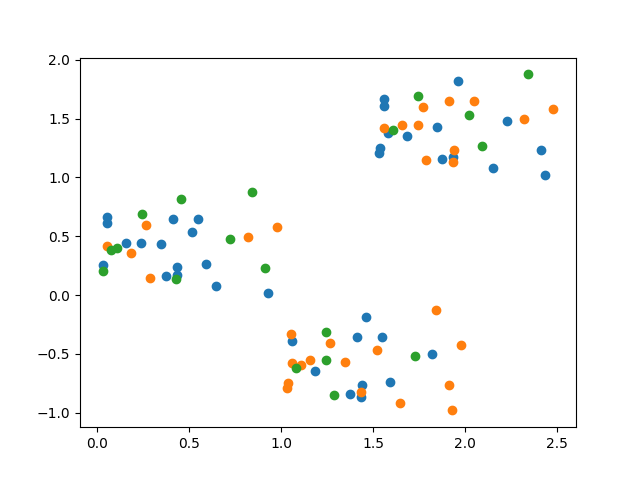
↓ 初期状態
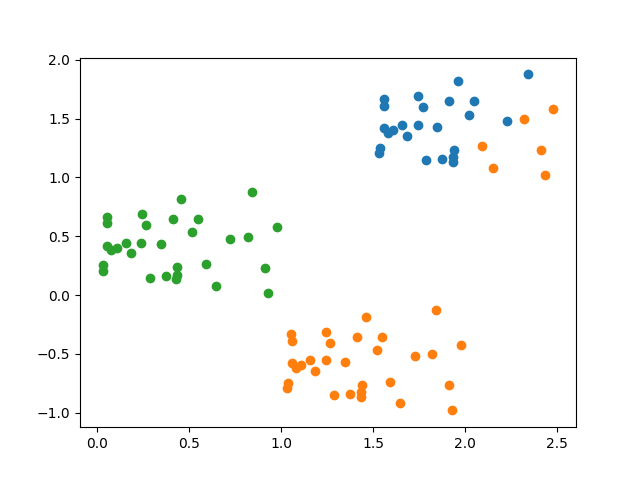
↓ 1サイクル目
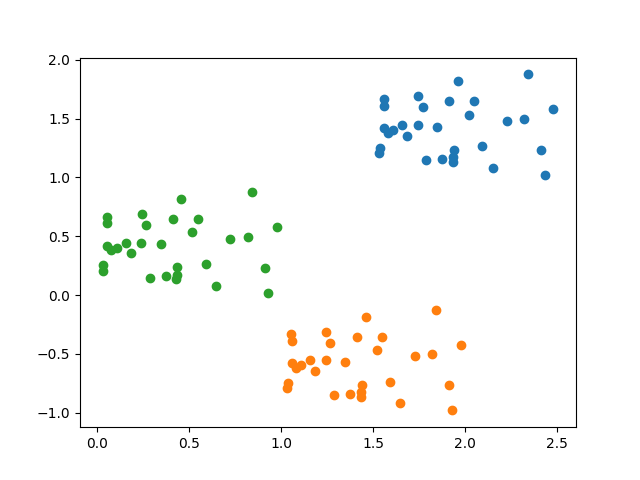
↓ 2サイクル目 (収束)
import numpy as np
import matplotlib.pyplot as plt


def plotPoints(x, y, clu, k):
    fig = plt.figure()
    ax = fig.add_subplot(111)
    for i in range(k):
        ax.scatter(x[clu == i], y[clu == i])


# data
n = 30
x = np.random.rand(n)
x = np.hstack([x, x + 1, x + 1.5])
y = np.random.rand(n)
y = np.hstack([y, y - 1, y + 1])

# number of clusters
k = 3

# assign initial clusters randomly
clu = np.random.randint(0, k, len(x))
plotPoints(x, y, clu, k)
plt.savefig('0.png')
plt.show()

ite = 0
while ite < 10:
    ite += 1

    # centroids of clusters
    vx = []
    vy = []
    for i in range(k):
        idx = clu == i
        vx.append(np.mean(x[idx]))
        vy.append(np.mean(y[idx]))

    # distance between the centroid and each point
    d = np.zeros([n * 3, k])
    for i in range(k):
        d[:, i] = np.sqrt((x - vx[i]) ** 2 + (y - vy[i]) ** 2)

    # assign new clusters
    newClu = np.argmin(d, axis=1)

    if all(newClu == clu):
        break
    else:
        clu = newClu
        plotPoints(x, y, clu, k)
        plt.savefig(f'{ite}.png')
        plt.show()