MatlabでTwitterのAPIを使う (3)
Matlabでツイッターから情報を集めるには、twittyがとても便利です。ただ、つぶやきを投稿するのには、自分の環境ではエラーが出てうまく使えませんでした。
さがしてみると、Update twitter statusというそのものズバリなコードがあり、これで上手くツイートすることができました。
jp.mathworks.com
ファイルをダウンロードしたら、まず、twit.mを 1 行だけ書き換えます。下の行を探して、.../1/を.../1.1/としましょう。
% url = URL('https://api.twitter.com/1/statuses/update.json');
url = URL('https://api.twitter.com/1.1/statuses/update.json');
それから、下のように入力するとGUIが出てくるので、ツイッターのアクセストークンを入力・保存します。
>> twitpref
それから、下のコードでツイートできます。すばらしい。
>> twit('テスト');
データをクラスタリングするk-means法を書いてみた
データをいくつかのグループにクラスタリングする手法としてk-means法があります。MatlabのStatistics and Machine Learning Toolboxには、kmeansというそのものズバリの関数があるのですが、アルゴリズムを体感するために自分で書いてみました。
Wikipediaによると、大まかなアルゴリズムは下の通り。
- 各データ点x(i)に対してランダムにクラスタを割りあてる。(クラスタ数は最初に自分で決める必要がある)
- 割りあてたデータ点をもとに、各クラスタの中心V(j)を計算。
- 各x(i)と各V(j)との距離を求め、x(i)を最も近い中心のクラスタに割りあてなおす。
- 上記の処理で、すべてのx(i)のクラスタの割り当てが変化しなかった場合、収束したと判断して終了。そうでない場合は、新しく割り振られたクラスタからV(j)を再計算して上記の処理を繰り返す。
これをそのまま試してみました。データとしては、50点からなるクラスタを適当に4つ撒きました。


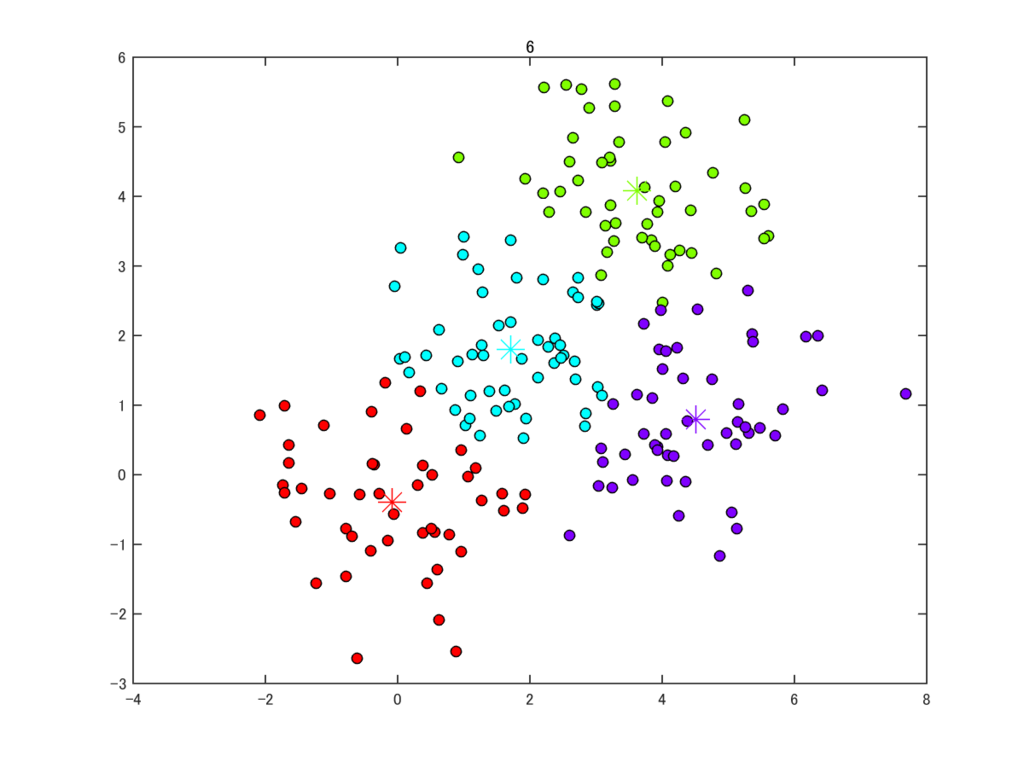

このデータだと7ステップで収束して処理が終了しました。それっぽくクラスタリングできていますね。
このオリジナルの方法はとても単純なのですが、このままだと、一番最初のランダムなクラスタの割りあてに依存して、明らかに変なクラスタリングをしてしまう場合もあります。この点を改良したk-means++法というのもあり、Matlabのkmeans関数で実装されているのはこちらのようです。
ほかに、複数のクラスタへの帰属を許した fuzzy c-means法というのもあったりします。
今回のコードは下の通り。
clear
rng(13)

% data
x = randn(50,2);
for ii=1:3
    x = [x; randn(50,2)+repmat(rand(1,2)*5,50,1)];
end

% number of clusters
k = 4;

% assign initial clusters randomly
clu = randi(k,[size(x,1),1]);

h = figure(1); clf
cycle=0;
while 1
    cycle = cycle+1;

    % centroids of clusters
    V = nan(k,2);
    for ii=1:k
        V(ii,:) = mean(x(clu==ii,:));
    end

    % plot
    for ii=1:k
        rgb = hsv2rgb(1/k*ii,1,1);
        % individual data points
        plot(x(clu==ii,1),x(clu==ii,2),'ko','markerfacecolor',rgb); hold on
        % centroid
        plot(V(ii,1),V(ii,2),'*','markersize',15,'color',rgb);
    end
    title(cycle)
    drawnow
    hold off
    % save image
    saveas(h,num2str(cycle),'png')

    % distance between data points and centroids
    d = nan(size(x,1),k);
    for ii=1:k
        d(:,ii) = sqrt( (x(:,1)-V(ii,1)).^2+(x(:,2)-V(ii,2)).^2 );
    end

    % update cluster label to the nearest centroid
    [~,cluNew] = min(d,[],2);

    % break if the new cluster label is identical to the previous one
    if any(clu~=cluNew)
        clu = cluNew;
    else
        break;
    end
end
自己組織化マップ (self-organizing map) を書いてみた
情報を自動で分類するアルゴリズムとして、自己組織化マップ (self-organizing map) というものが知られています。自己組織化マップは教師無し学習の一種で、おおざっぱな学習則はつぎの通りです。
1. ランダムな重みベクトルからなるマップを用意する。
2. 入力ベクトルを1つ用意する。
3. 入力にもっとも近いノードをみつける。
4. そのノードと、近傍のノードとを、入力ベクトルに近づける。
5. ステップ2-4をたくさん繰り返す。
ちゃんとした学習則は、Wikipediaなどを参考に。提唱者Kohonen自身による下の著作もあります。

- 作者: T.コホネン,大北正昭,シュプリンガージャパン,Teuvo Kohonen
- 出版社/メーカー: 丸善出版
- 発売日: 2016/02
- メディア: 単行本
- この商品を含むブログを見る
これをMatlabで書いてみました。色 (赤・緑・青の3要素からなるベクトル) を自動で分類します。最初のランダムなマップはたとえば下のような状態。
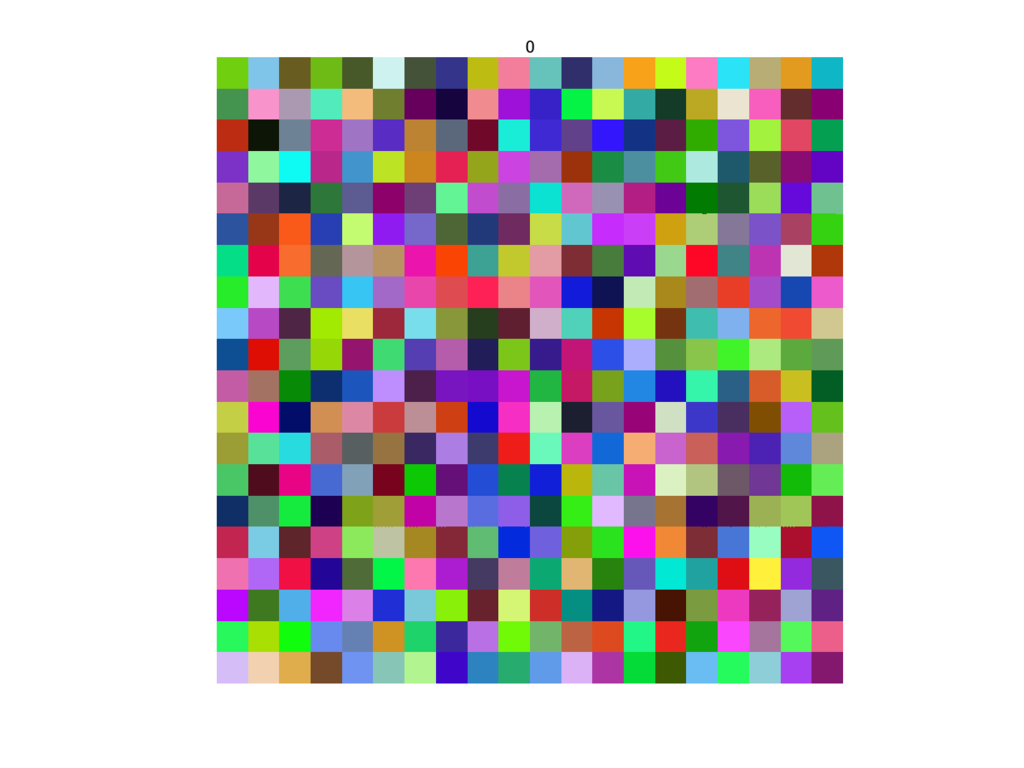
ここから、ステップ2-4を繰り返していきます。100回目が終わるとこんな感じ↓ まだあまり変化が分かりません。

200回目↓

500回目↓ マップがすこし滑らかになってきました。

1000回目↓

2000回目↓

5000回目↓ 似た色が自動的に近くのノードに配置されています。

アニメーションでみるとこんな感じ↓
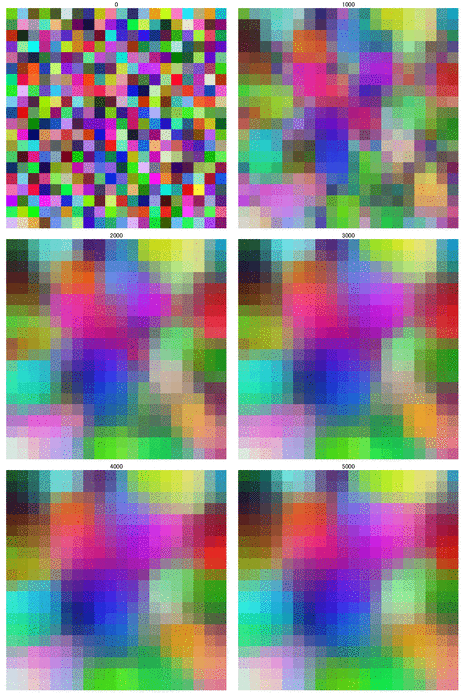
シンプルな学習則なのに、情報を自動で分類できるところが面白いですね。「色」は構造のよく分かったデータですが、全体像の見えにくい高次元のデータにも適用することができます (というより自己組織化マップが真価を発揮するのはそういう場面のはず)。
今回のコードは下の通りです (ステップ4の部分はもっとスッキリ書けると思いますが、ひとまずこのままで)。
function SOMtest

figure(1);
clf
N = 20;      % map size
a = 0.1;     % learning coefficient

% random weight vector (step 1)
W = rand(N,N,3);
image(W)
title('0')
axis image off
drawnow
saveas(h,'0','png')

for t=1:5000
    % input vector (step 2)
    V = rand(1,1,3);

    % find the nearest node (step 3)
    D = sum((W-repmat(V,N,N,1)).^2,3);
    [~,I] = min(D(:));
    [Irow,Icol] = ind2sub(size(D),I);

    % update the weight vector (step 4)
    for ii=-1:1
        for jj=-1:1
            if 0<Irow+ii && Irow+ii<=N && 0<Icol+jj && Icol+jj<=N
                W(Irow+ii,Icol+jj,:) = ...
                    W(Irow+ii,Icol+jj,:) + a*(V-W(Irow+ii,Icol+jj,:));
            end
        end
    end
    image(W)
    title(t)
    axis image off
    drawnow

    % save image
    if mod(t,100)==0
        saveas(h,num2str(t),'png')
    end
end
MatlabでTwitterのAPIを使う (2)
前回の記事のままでは、(英語のツイートは良いのですが) 日本語のツイートはちゃんと表示されません。
たとえば下のように@MATLAB_jpのツイートを取得すると、\u(4ケタの16進数)の羅列からなるユニコードが得られます。
tw = twitty();
S = tw.userTimeline('screen_name', 'MATLAB_jp');
disp(S{1}{1}.text)

#MATLAB \u4fbf\u5229\u95a2\u6570\u7d39\u4ecb \u300cismember\u300d...
そこで、下の関数unicode2txt.mで読めるテキストに変換することにします。関数hex2decでユニコードの16進数を10進数に変換し、さらに関数charで文字に変換しています。
% convert unicode-including string to readable text
function str = unicode2txt(str)

idx = strfind(str,'\u');
for ii=1:length(idx)
    idxTmp = idx(end+1-ii);
    str(idxTmp) = char(hex2dec(str(idxTmp+2:idxTmp+5)));
    str(idxTmp+1:idxTmp+5) = [];
end
これで下のような日本語テキストを得ることができます。
tw = twitty();
S = tw.userTimeline('screen_name', 'MATLAB_jp');
disp(unicode2txt((S{1}{1}.text)))

#MATLAB 便利関数紹介 「ismember」 はデータの重複した要素を探す関数ですが、...
MatlabでTwitterのAPIを使う
MatlabでTwitter APIを使ってデータを取得する方法をまとめました。
Twitterのアカウントを持っていない場合は、まずアカウントを作ります。それから、Twitter Platformにアクセスして、APIを使うために必要なキー4種類を取得します。このサイトのお世話になりました。
次に、File ExchangeからtwittyとJSON Parserをダウンロードします。このtwittyがスグレモノです。parse_json.mはtwittyのファイル群と同じフォルダに置いておきましょう。
で、Matlabを起動して、twitty.mの説明通りに設定します。まずは、
>> tw = twitty()
と入力します。何か警告が出るかもしれませんが、続けて
>> tw.saveCredentials()
と入力。すると下のようなGUIが登場するので、先ほど取得したキーをコピペします。このキーの入力は1回限りです (Matlabを再起動しても再び入力する必要はない)。

これで準備完了です!試しに、@MATLABのツイートを取得してみましょう。
>> S = tw.userTimeline('screen_name', 'matlab')
結果は下のようになって、S{1}{インデックス}.textにツイートの内容が格納されます。
>> S

S =

    {1x20 cell}

>> S{1}{1}

ans =

                   created_at: 'Wed Dec 28 13:24:16 +0000 2016'
                           id: 8.1410e+17
                       id_str: '814099651293020160'
                         text: 'Get started with MATLAB and #Ardui...'
                    truncated: 0
                     entities: [1x1 struct]
            extended_entities: [1x1 struct]
                       source: '\u003ca href="http://www.hootsuite...'
        in_reply_to_status_id: []
    in_reply_to_status_id_str: []
          in_reply_to_user_id: []
      in_reply_to_user_id_str: []
      in_reply_to_screen_name: []
                         user: [1x1 struct]
                          geo: []
                  coordinates: []
                        place: []
                 contributors: []
              is_quote_status: 0
                retweet_count: 11
               favorite_count: 23
                    favorited: 0
                    retweeted: 0
           possibly_sensitive: 0
lang: 'en'おもなメソッドは、twittyのページに書いてありますし、一覧は下のようにタイプすると得られます。簡単ですね。
>> twitty.API
%% METHODS INTERFACING TWITTER API:
%% TIMELINES
 homeTimeline()              Returns a collection of the most recent statuses posted by the authenticating user
 userTimeline()              Returns a collection of the most recent Tweets posted by the user indicated by the
 mentionsTimeline()          Returns the 20 most recent mentions (status containing @username)
 retweetsOfMe()              Returns the most recent tweets of the authenticated user that have been retweeted
%% STREAMING
 sampleStatuses()            Returns a small random sample of all public statuses via streaming API.
 filterStatuses()            Returns public statuses that match one or more filter predicates.
%% TWEETS
 updateStatus()              Update the authenticating user's status (twit).
 retweets()                  Returns up to 100 of the first retweets of a given tweet.
 showStatus()                Returns a single status, specified by the id parameter below.
 destroyStatus()             Destroys the status specified by the required ID parameter.
 retweetStatus()             Retweets a tweet specified by the required ID parameter.
 retweeters()                Returns a collection of up to 100 ids of users who retweeted the specified status.
%% SEARCH
 search()                    Search twitter.
%% FRIENDS & FOLLOWERS
 friendsIds()                Returns an array of numeric IDs for every user the specified user is following.
 followersIds()              Returns an array of numeric IDs for every user following the specified user.
 friendshipsLookup()         Returns the relationship of the authenticating user to a list of up to 100
 friendshipsCreate()         Allows the authenticating users to follow the specified user.
 friendshipsDestroy()        Allows the authenticating users to unfollow the specified user.
 friendshipsShow()           Returns detailed information about the relationship between two arbitrary users.
%% USERS
 usersLookup()               Return up to 100 users worth of extended information, specified by either ID,
 usersShow()                 Returns extended information about a given user.
 usersSearch()               Runs a search for users similar to "Find People" button on Twitter.com.
%% ACCOUNTS
 accountSettings()           Returns settings (including current trend, geo and sleep time information)
 accountVerifyCredentials()  Test if supplied user credentials are valid.
%% TRENDS
 trendsPlace()               Returns the top 10 trending topics for a specific place (woeid),
 trendsAvailable()           Returns the locations that Twitter has trending topic information for.
 trendsClosest()             Returns the locations that Twitter has trending topic information for, closest to
%% PLACES & GEO
 geoInfo()                   Returns all the information about a known place.
 geoReverseCode()            Given geographical coordinates, searches for up to 20 places that can be used
 geoSearch()                 Search for places that can be attached to a statuses/update.
 geoSimilarPlaces()          Locates places near the given coordinates which are similar in name.
%% HELP
 helpConfiguration()         Returns the current configuration used by Twitter including twitter.com slugs
 helpLanguages()             Returns the list of languages supported by Twitter along with their ISO 639-1 code.
%% THE MAIN API CALLER
 callTwitterAPI()            Call to the twitter API.
カオス (2)
Pythonの勉強のために、前回にMatlabで書いたロジスティック写像のスクリプトを、Python 3.5で書き直してみます。Matlabの1から始まるインデックスに慣れているので、Pythonの0から始まるインデックスは混乱します・・・。
import matplotlib.pyplot as plt

# 漸化式の計算
a = 4
x = [0.9]
for i in range(99):
    x.append(a * x[i] * (1-x[i]))

# プロット
plt.plot(range(1,101,1),x)
plt.title('a = '+str(a))
plt.xlabel('n')
plt.ylabel('x[n]')
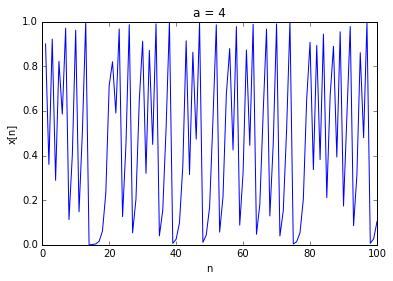
これで、下のようにa = 4のときの振舞いを描くことができました。
つぎに、aの値を少しずつ変えたときの分岐図も描いてみます。
import matplotlib.pyplot as plt
import numpy as np

for a in np.arange(0,4,0.001):
    x = [0.9]
    for i in range(99):
        x.append(a * x[i] * (1-x[i]))
    plt.plot([a]*20,x[80:100],'b.')

plt.xlabel('a')
plt.ylabel('x[n]')
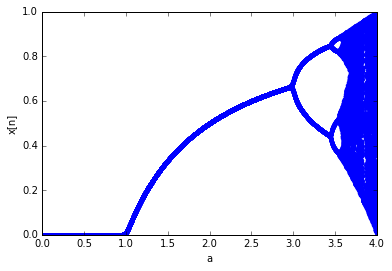
これで、下のように分岐図をかけました。Pythonはド素人ですが、ちょこちょこ勉強していこうと思います。

- 作者: Bill Lubanovic,斎藤康毅,長尾高弘
- 出版社/メーカー: オライリージャパン
- 発売日: 2015/12/01
- メディア: 単行本(ソフトカバー)
- この商品を含むブログ (1件) を見る
カオス
「部屋がカオス」といえば部屋が乱雑に散らかっていることを指すと思いますが、「カオス理論」というときのカオスは単に乱雑ということとはもちろん違います。
有名なロジスティック写像を例にしてカオスの様子を覗いてみましょう。ロジスティック写像は、
であらわされる単純な漸化式です。電卓でも簡単に計算できますね。たとえば、定数a=0.5, 初期値x(1)=0.9とすれば、x(2) = 0.5*0.9*(1-0.9) = 0.045, x(3) = 0.5*0.045*(1-0.045) = 0.0215, ...という具合です。
一見したところ単純で、しかも決定論的 (前の値によって次の値が完全に決まる) なこの式ですが、定数aの値によって多彩な振る舞いをします。aの値を変えて様子を見てみましょう。
下のMatlabスクリプトで、まず、a=0.5のときの様子を描いてみます。初期値x(1)は適当に0.9としました。
clear;
a = 0.5;
x(1) = 0.9;

for n=1:99
    x(n+1) = a * x(n) * (1-x(n));
end

figure(1); clf
plot(1:100,x,'.-')
xlabel('n')
ylabel('x(n)')
title(strcat('a=',num2str(a)))
ylim([0 1])
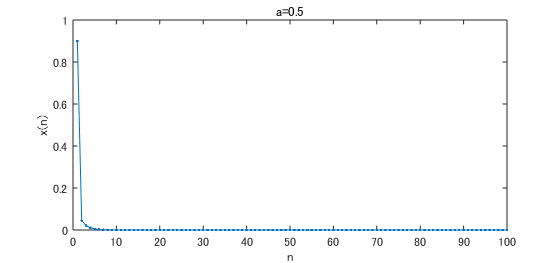
a=0.5だと値がすぐに0に収束します。では次にa=2として描いてみます。

この場合も特定の値に収束しました。次にa=3.3としてみましょう。
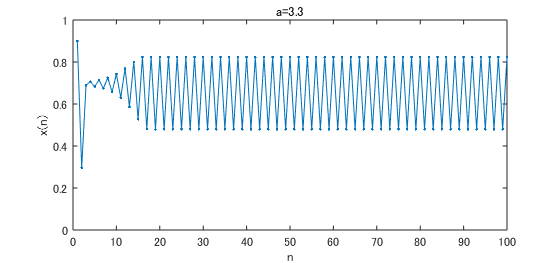
この場合は収束せず、2つの値のあいだで振動しています。では、a=3.5はどうでしょうか。
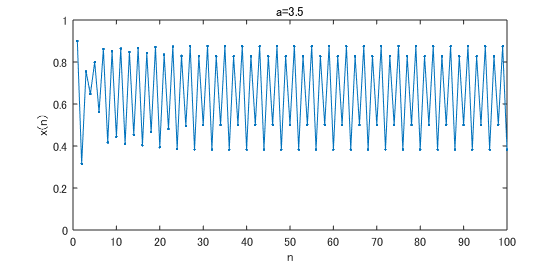
この場合も振動していますが、値が4通りあることがわかります。では、a=3.8としてみます。
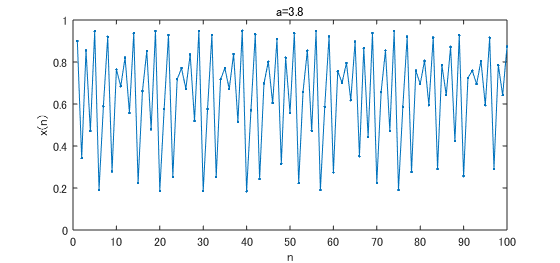
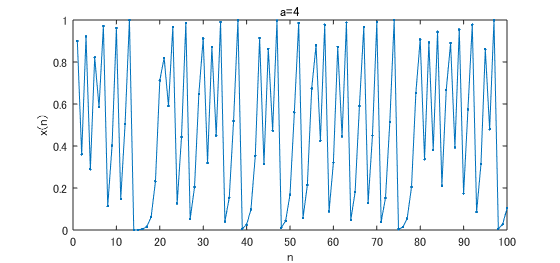
すると先ほどまでとは違い、さまざまな値をとりながら (一見したところ) 不規則に揺れ動いています。このような状態がカオスです。さらにa=4とすると、0から1のすべての値をとるカオスとなります。
以上のような状態の変化を見通しよくするために、下のスクリプトで「分岐図」を描いてみます。aの値を0から4のあいだで小刻みに変えて、x(100)まで計算し、最後の20点のみをプロットしています (例として挙げたaの値には赤線を引きました)。
clear;
x(1) = 0.9;
figure(1); clf
for a = 0:0.001:4
    for ii=1:99
        x(ii+1) = a * x(ii) * (1-x(ii));
    end
    plot(a*ones(1,20),x(81:100),'b.');
    hold on
end
title('分岐図')
xlabel('a')
ylabel('x(n)')

plot([0.5 0.5],[0 1],'r:')
plot([2.0 2.0],[0 1],'r:')
plot([3.3 3.3],[0 1],'r:')
plot([3.5 3.5],[0 1],'r:')
plot([3.8 3.8],[0 1],'r:')
plot([4.0 4.0],[0 1],'r:')
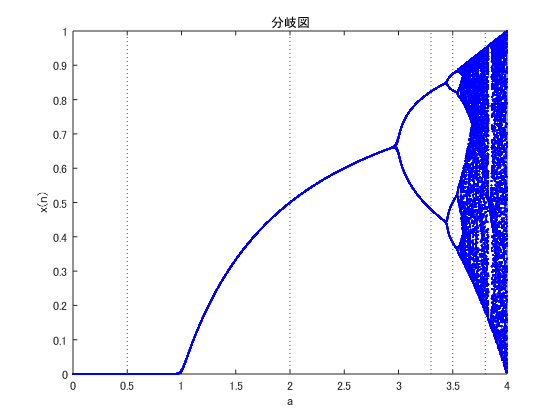
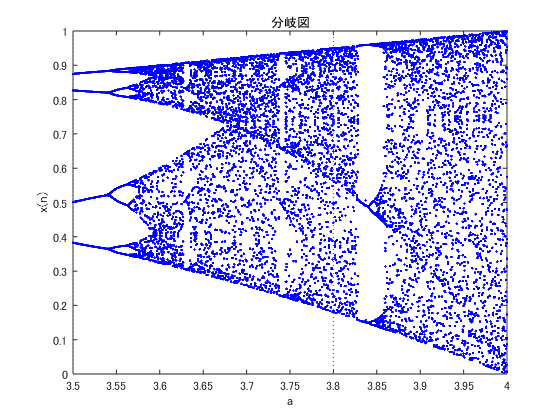
上のプロットを見ると、aの増加にともなって、値の収束が1点, 2点, 4点...と増えていることが分かります。これを「周期倍分岐」といいます。そして、a=3.56付近以上でカオスが登場することが分かります。
分岐図をよく見てみると、同じような構造が何回も登場することが分かります。下のスクリプトでa=3.8から3.9の範囲をこまかくプロットしなおしてみましょう。
clear;
x(1) = 0.9;
figure(1); clf
for a = 3.8:0.0001:3.9
    for ii=1:199
        x(ii+1) = a * x(ii) * (1-x(ii));
    end
    plot(a*ones(1,20),x(181:200),'b.');
    hold on
end
title('分岐図')
xlabel('a')
ylabel('x(n)')
xlim([3.8 3.9])
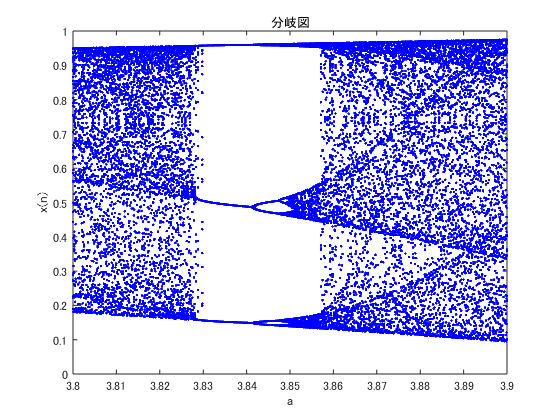
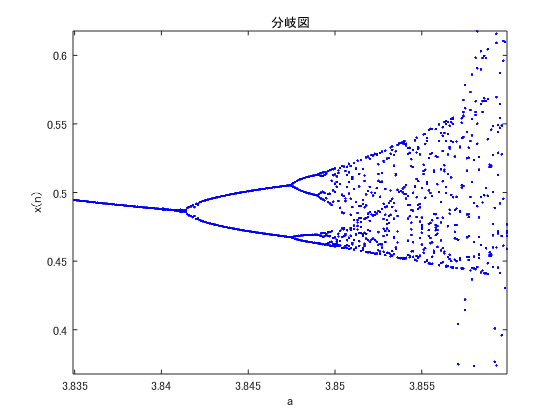
a=3.84から3.85のあたりを拡大してみるとここにも分岐が見えます。拡大してもおなじ形が見えることを「自己相似」といい、完全な自己相似性をもつ図形は「フラクタル」と呼ばれます。
さて、カオスの重要な特徴として、将来の予測が (事実上) 不可能だという点があります。現実の世界の数値にはつねに誤差があります (たとえば体重を測るにしても測定誤差があり、無限の精度で測定するということはできません)。カオスな世界では初期値のわずかな誤差があっという間に増幅されてしまい、遠い将来の値を予測することが事実上できません。これを「初期値鋭敏性」と呼びます。
下のスクリプトで初期値鋭敏性をシミュレーションしてみましょう。カオスな条件 (a=4) で、初期値が0.9の数値列x(n)と、初期値が0.9から1/10万だけずれた数値列y(n)を比較してみます。
% ロジスティック写像の計算
clear;
a = 4;
x(1) = 0.9;
y(1) = x(1)*1.00001;

for n=1:99
    x(n+1) = a * x(n) * (1-x(n));
    y(n+1) = a * y(n) * (1-y(n));
end

% x(n), y(n) をプロット
figure(1); clf
subplot(3,1,1:2)
plot(1:100,x,'b.-',1:100,y,'r.-')
ylabel('x(n), y(n)')
title(strcat('a=',num2str(a)))
ylim([0 1])

% x(n)-y(n) をプロット
subplot(3,1,3)
plot(1:100,x-y,'k.-')
xlabel('n')
ylabel('x(n)-y(n)')
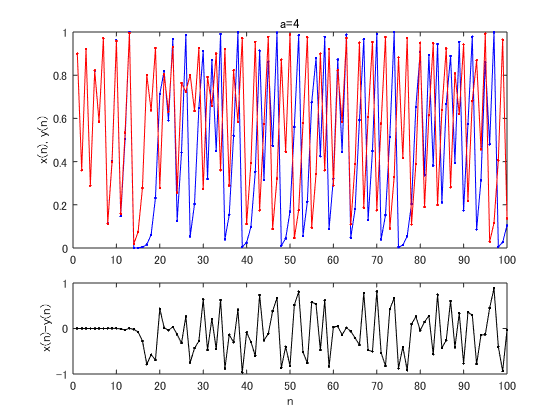
n=14あたりまでは、青線のx(n)と赤線のy(n)はほとんど同じ値でプロットが重なっていますが、それ以降はまったく別の値をとり、プロットが重ならないことが分かります。1/10万の誤差がいつの間にか増幅されたわけです。
以上のロジスティック写像にはランダムなノイズはまったく含まれておらず、完全に決定論的です。このように、「決定論的なのに将来が予測できない」というところにカオスの衝撃があります。

- 作者: 早間慧
- 出版社/メーカー: 現代数学社
- 発売日: 2002/02
- メディア: 単行本
- クリック: 1回
- この商品を含むブログを見る